
You can score leads without a big CRM by assigning points to the characteristics and actions that matter most to your sales process. A spreadsheet, basic CRM, or lightweight sales tool can be enough to rank leads, identify high-priority prospects, and decide who your team should contact first.
The trick is not to give points for everything a lead does. A useful lead scoring system separates fit from buying behavior, gives stronger signals more weight, subtracts points for poor-fit prospects, and gets better as you compare scores with actual sales results.
Table of Contents
Lead scoring is a way to rank prospects based on how well they match your ideal customer and how strongly they are showing buying intent. You can build a useful model without expensive automation by using a simple point system and reviewing the results against your real sales data.
- Start with fit: Score job title, company size, industry, location, budget, or other characteristics that define your ideal customer.
- Add behavior: Give points for meaningful actions such as demo requests, pricing inquiries, sales replies, or product trials.
- Weight important signals: A demo request should matter more than a routine email open.
- Subtract negative signals: Competitors, poor-fit prospects, unsubscribes, and inactive leads should reduce the score.
- Use a simple formula: Combine fit and behavior scores, then subtract negative points.
- Let old activity lose value: A recent buying signal is usually more useful than the same action several months ago.
- Validate the model: Compare high-scoring and low-scoring leads with actual opportunities and closed deals.
- Use the simplest tool that works: A spreadsheet can be enough to start, while a lightweight sales platform can make ongoing lead management easier.
Lead scoring commonly combines explicit information about a prospect with implicit information about their behavior. Job title, co
What Is Lead Scoring?
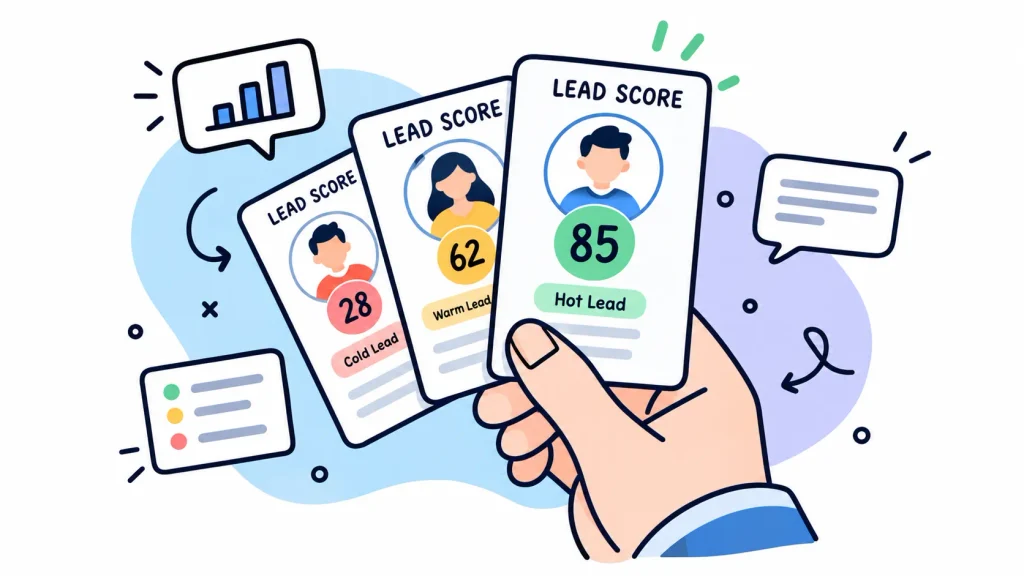
Lead scoring is a system for assigning numerical values to prospects so a sales team can prioritize them based on customer fit and buying behavior.
Instead of asking, “Which lead should we contact first?” based on intuition, you can use a consistent set of criteria.
For example:
| Lead | Fit Score | Intent Score | Negative Score | Final Score | Priority |
|---|---|---|---|---|---|
| Sarah | 40 | 38 | 0 | 78 | High |
| Michael | 35 | 20 | 0 | 55 | Medium |
| David | 15 | 12 | -10 | 17 | Low |
The score does not predict the future with certainty. It simply gives your team a practical way to rank a large group of prospects.
A good lead scoring system answers three questions:
- Does this person look like our customer?
- Are they showing signs that they may want to buy?
- Is there anything that makes them less valuable or less likely to convert?
Why Does Lead Scoring Matter for Small Teams?
Lead scoring helps small teams spend limited sales time on the prospects most worth pursuing. If you Lead scoring helps small teams focus limited sales time on the prospects most worth pursuing. If you have 20 leads, your sales team may be able to review each one manually. With 500 leads, that approach quickly becomes difficult to manage.
Without a scoring system, teams often fall into a few common habits:
- Contacting leads in the order they arrived
- Prioritizing whoever replied most recently
- Spending too much time on highly active but poorly qualified leads
- Overlooking quieter prospects that closely match the ideal customer profile
- Relying on individual sales reps to make different judgment calls
A simple scoring model creates a shared standard for deciding which leads deserve attention first.
It does not need to be perfect. It needs to be consistent, understandable, and useful enough to improve prioritization.
And you do not need an expensive marketing automation platform to get started. A spreadsheet or a basic CRM field can handle the underlying logic if your scoring criteria are clear and consistently applied.
As your lead volume grows, you can make the model more sophisticated. Start with a few meaningful signals, measure how well they predict sales opportunities, and refine the system based on what you learn.
What Should You Include in a Lead Score?
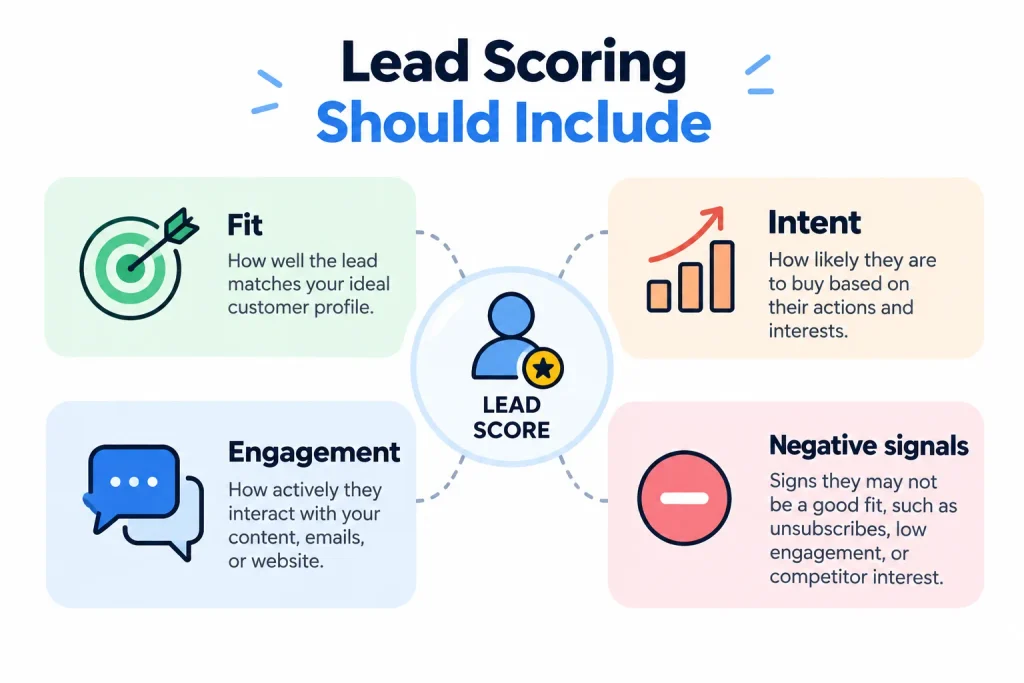
A practical lead score should combine four types of information: customer fit, buying intent, engagement, and negative signals.
| Scoring Area | What It Tells You | Examples |
|---|---|---|
| Fit | Is this the right type of customer? | Industry, company size, job title |
| Intent | Are they considering a purchase? | Demo request, pricing inquiry |
| Engagement | How actively are they interacting? | Email reply, product visit |
| Negative signals | Is there a reason to lower priority? | Competitor, poor fit, inactivity |
You do not need to score every possible attribute.
Start with the information that helps distinguish your best customers from everyone else.
How Should You Score Lead Fit?
Lead fit measures how closely a prospect matches your ideal customer profile. Useful fit criteria can Lead fit measures how closely a prospect matches your ideal customer profile. Common fit criteria include:
- Job title
- Company size
- Industry
- Geographic market
- Business model
- Budget
- Use case
- Technology stack
For example, suppose you sell project management software primarily to agencies with 20 to 200 employees.
A project manager at a 75-person agency might receive strong fit points because they match your target role, company size, and industry. In contrast, a student using a personal email address might receive few or even negative points, even if they visit your website frequently.
Fit helps your scoring model distinguish interest from suitability. A prospect can be highly engaged with your content but still be a poor fit for what you sell.
How Should You Score Buying Intent?
Buying intent measures actions that suggest a prospect is actively considering a purchase or moving closer to a buying decision.
Common buying-intent signals include:
- Requesting a demo
- Starting a trial
- Asking about pricing
- Requesting a proposal
- Contacting sales
- Replying to an outreach message
- Asking about integrations
- Asking about implementation
These actions should generally carry more weight than passive engagement because they indicate a stronger connection to a potential purchase.
For example, reading three blog posts may show that someone is interested in a topic. Requesting a product demonstration, asking about pricing, or discussing implementation shows a much clearer commercial intent.
The exact weight should depend on your business and historical conversion data. A demo request may be a strong signal for one company, while a pricing-page visit or free-trial signup may be more predictive for another.
How Should You Score Engagement?
Engagement captures the actions a lead takes while interacting with your website, content, emails, or other marketing channels. These signals can provide useful context, but they do not always indicate strong buying intent.
Common engagement signals include:
- Visiting your website
- Returning to a product page
- Viewing a pricing page
- Downloading a case study
- Attending a webinar
- Opening an email
- Replying to an email
The important distinction is quality over quantity.
If every page view receives five points, a lead could become “hot” simply by browsing your website frequently. That creates score inflation and can push low-intent leads ahead of better prospects.
Instead, give more weight to engagement that is reasonably connected to a potential purchase. A pricing-page visit, case study download, or return visit to a product page may be more meaningful than several visits to general blog content.
Should You Use Negative Lead Scoring?
Yes. Negative scoring is useful because activity alone does not mean a lead is valuable.
For example, a competitor might visit every page on your website. A student might download several resources. A job seeker might spend 20 minutes reading your careers page. All three could generate significant engagement without representing a genuine sales opportunity.
Examples of negative signals include:
| Negative Signal | Example Score |
|---|---|
| Student or job seeker | -20 |
| Competitor | -40 |
| Outside target market | -15 |
| Unsubscribed | -25 |
| Extended inactivity | -10 |
| Personal email for a B2B product | -5 |
The numbers above are examples, not universal standards.
Your negative points should reflect how strongly each signal is associated with poor lead quality in your business. Review your historical leads to identify patterns, then adjust the weights as you learn which signals actually predict conversion.
Negative scoring should not automatically disqualify a lead. It should help balance strong engagement signals with evidence that a prospect may not be a good fit or may no longer be interested.
How Do You Build a Simple Lead Scoring System?
You can build a basic lead scoring system by defining your ideal customer, selecting a small number of criteria, assigning weights, and creating clear score ranges.
A simple process looks like this:
Define → Score → Prioritize → Validate → Improve
1. Define Your Ideal Customer
Start with your existing customers. Look for patterns among the people and companies that actually become customers, not just those who show high engagement.
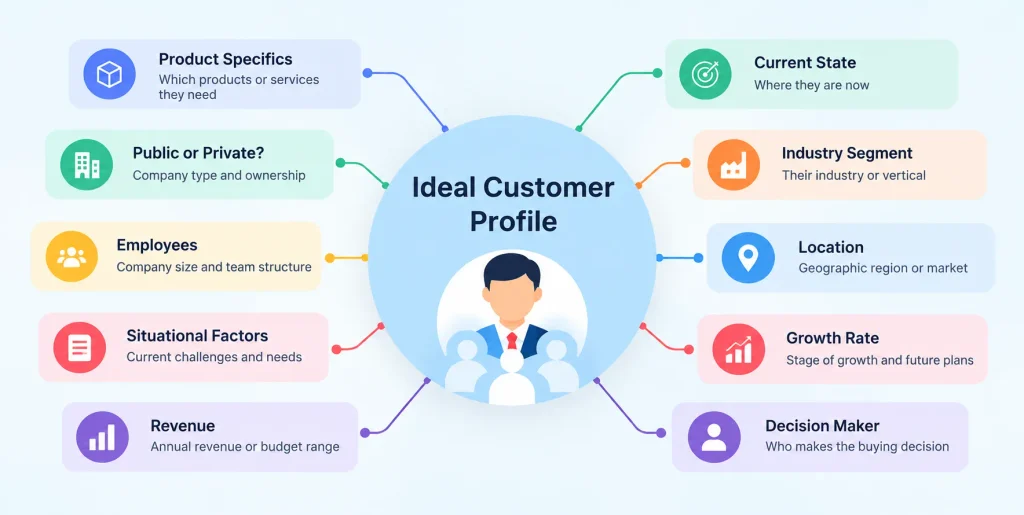
Ask:
- Which industries convert best?
- What company sizes do you serve most successfully?
- Which job titles are usually involved in the buying decision?
- What problems are your best customers trying to solve?
- Which types of leads rarely become customers?
- Which characteristics do your highest-value customers have in common?
Use these patterns to define your ideal customer profile (ICP). Your ICP then becomes the foundation for assigning fit scores later in the lead scoring model.
For example, if your best customers are mid-sized marketing agencies with 20 to 200 employees, you can assign higher fit scores to leads that match those characteristics and lower scores to leads that fall outside your target market.
2. Choose Five to Eight Meaningful Signals
Do not start with 30 criteria.
A small team is more likely to maintain a scoring model with a handful of clear, meaningful signals than one with dozens of variables. Start with the signals most closely connected to lead quality and buying intent, then review the model as you collect more conversion data.
A simple starting set could be:
| Signal | Category | Example Weight |
|---|---|---|
| Decision-maker role | Fit | High |
| Target company size | Fit | High |
| Target industry | Fit | Medium |
| Demo request | Intent | Very high |
| Pricing inquiry | Intent | High |
| Sales reply | Intent | High |
| Case study download | Engagement | Low |
| Competitor | Negative | Very high |
These weights are starting points, not universal standards. A demo request might be one of your strongest signals, while a case study download may provide useful context without being strong enough to make a lead sales-ready on its own.
The goal is to keep the model simple enough to explain and useful enough to prioritize leads. As you gather more data, compare these signals against actual sales outcomes and adjust the weights accordingly.
3. Assign Points Based on Importance
Not every signal should have the same value. Give more points to actions and characteristics that are closely associated with buying intent or strong lead fit, and fewer points to weaker engagement signals.
For example:
| Signal | Example Score |
|---|---|
| Demo request | +25 |
| Pricing inquiry | +20 |
| Decision-maker | +15 |
| Target industry | +10 |
| Case study download | +5 |
| Email open | +1 |
These numbers are illustrative. Your actual weights should be based on your business, sales process, and historical conversion data.
The goal is to prevent weak engagement signals from overpowering meaningful buying signals. Someone who opens 10 emails should not automatically outrank a well-qualified prospect who requests a demo.
4. Create Clear Score Bands
Once you have a total score, divide leads into clear groups with a defined action for each group.
For example:
| Score | Category | Suggested Action |
|---|---|---|
| 80–100 | Hot | Immediate sales follow-up |
| 60–79 | Warm | Active follow-up and nurturing |
| 40–59 | Developing | Monitor and nurture |
| Below 40 | Cold | Low-priority follow-up |
These ranges are starting points, not universal benchmarks. Your thresholds should reflect your own lead volume, conversion rates, sales capacity, and historical data.
The goal is to make the score actionable. A sales representative should know what to do when a lead moves from one band to another, rather than treating the score as just another number in the CRM.
What Is a Simple Lead Scoring Formula?
A weighted lead scoring formula combines fit and behavior scores, then subtracts points for negative signals.
A practical formula is:
Lead Score = (Fit Score × Fit Weight) + (Behavior Score × Behavior Weight) – Negative Points
The fit and behavior weights should add up to 1.
For example:
Fit Weight = 0.5
Behavior Weight = 0.5
Suppose a lead has:
- Fit score: 70
- Behavior score: 80
- Negative score: 10
The calculation is:
(70 × 0.5) + (80 × 0.5) − 10
= 35 + 40 − 10
= 65
The lead therefore receives a 65-point score.
A 50/50 split is a simple starting point when you are building a model from scratch. You can adjust the weights later based on which signals actually correlate with qualified opportunities and conversions.
For example, an inbound team with rich behavioral data may give more weight to behavior. An outbound team with limited engagement data may rely more heavily on fit.
The important part is not finding a perfect formula immediately. It is creating a model that is easy to understand, consistently applied, and improved as you collect more sales data.sales.
How Do You Know Which Signals Deserve More Points?
The best way to improve point values is to compare your leads with your actual customers.
One useful measurement is lift.
The basic formula is:
Lift = % of closed-won leads with an attribute ÷ % of all leads with that attribute
For example, suppose:
- 40% of your closed-won customers were decision-makers.
- 20% of all your leads were decision-makers.
Your lift would be:
40% ÷ 20% = 2.0
This means decision-maker status appears twice as often among your successful customers as it does across your overall lead pool.
A higher lift suggests that an attribute may be more useful for predicting conversion and could deserve more points.
You can use broad ranges as a starting framework:
| Lift | Interpretation | Possible Treatment |
|---|---|---|
| 3.0+ | Very strong signal | High points |
| 2.0–2.9 | Strong signal | Above-average points |
| 1.4–1.9 | Moderate signal | Moderate points |
| 1.0–1.3 | Weak signal | Few or no points |
| Below 1.0 | Inverse signal | Consider negative points |
These ranges are guidelines, not statistical rules. A high lift does not automatically mean a signal causes conversion or should receive a large number of points. Consider the size of your dataset and whether the pattern remains consistent over time.
The purpose is not to create perfect statistical precision. It is to reduce guesswork and prevent your scoring model from assigning arbitrary weight to signals that have little connection with actual sales outcomes.
What Does a Practical 100-Point Model Look Like?
A simple 100-point model can make your scoring system easier for salespeople to understand and apply.
Here is an original example:
| Factor | Points |
|---|---|
| Matches ideal customer profile | +20 |
| Decision-maker or strong buying role | +15 |
| Target company size | +10 |
| Target industry | +10 |
| Requested a demo | +20 |
| Asked about pricing | +15 |
| Replied to sales outreach | +10 |
| Maximum positive score | 100 |
Then add negative adjustments:
| Negative Signal | Points |
|---|---|
| Poor company fit | -15 |
| Student or job seeker | -20 |
| Competitor | -40 |
| Unsubscribed | -25 |
| Long-term inactivity | -10 |
This gives your team a model that is easy to explain:
Fit + Intent + Engagement – Negative Signals = Lead Priority
The actual numbers should change when your sales data shows that different signals are more or less predictive.
Should Repeated Activities Have a Limit?
Yes. Repeated low-intent activities should usually have a cap. Without one, frequent activity can inflate a lead’s score without providing much additional evidence of buying intent.
Consider email opens. If each open adds two points, someone who opens 30 emails could accumulate 60 points without ever showing serious buying intent.
A better approach could be:
Email open = +2 points, maximum +10 points
You can apply similar limits to repetitive activities such as:
- Pageviews
- Content downloads
- Email opens
- Repeat website sessions
The cap prevents repeated low-intent activity from overpowering stronger signals, such as a demo request, pricing inquiry, or sales conversation.
The exact cap depends on your sales process and historical data. The goal is to make repeated activity useful as supporting evidence, rather than allowing it to determine the lead’s score on its own.
Should Lead Scores Decay Over Time?
Yes, especially for behavioral activity. A buying signal from yesterday is usually more relevant than the same signal from six months ago.
For example, you might create a simple decay rule:
- Activity within 30 days: 100% of points
- Activity 31 to 60 days old: 50% of points
- Activity older than 60 days: 25% of points
- Activity older than 90 days: 0 points
These periods are examples, not universal rules.
If your average sales cycle is three weeks, you may need faster decay. If your sales cycle is six months, a 30-day decay could be too aggressive.
The important principle is simple:
Recent intent should matter more than stale intent.
Tomba similarly recommends reducing the value of behavioral activity over time and allowing older activity to expire.
How Should You Set Lead Score Thresholds?
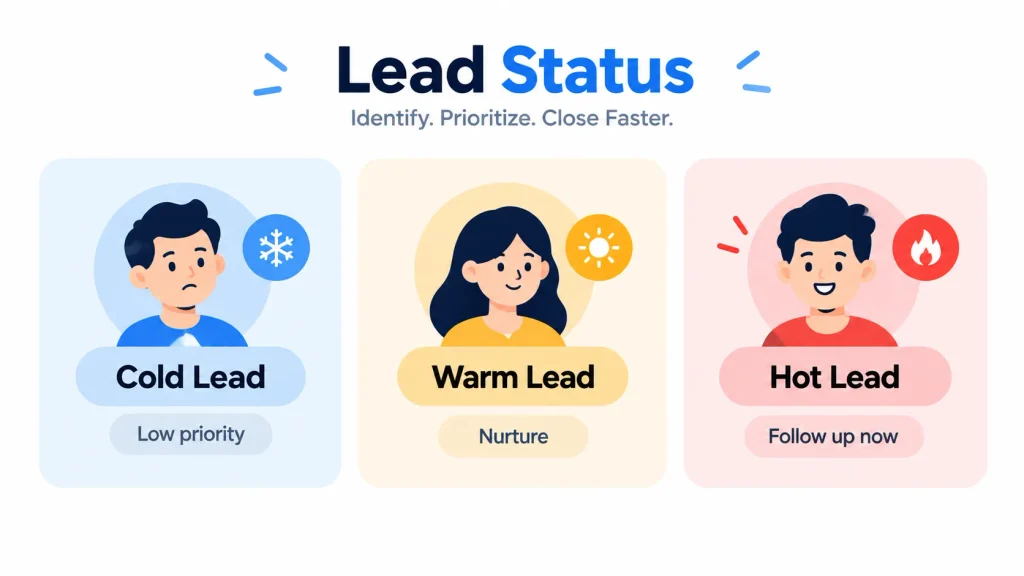
Your thresholds should reflect both your sales capacity and your actual conversion data.
Suppose your business receives 300 leads per month, but your sales team can realistically work 60 high-priority leads. You do not want 200 leads classified as “hot” simply because the threshold is too low.
Instead, review your score distribution and choose a threshold that produces a manageable number of high-priority leads.
A simple starting framework is:
| Score | Lead Status | Sales Action |
|---|---|---|
| 80–100 | Hot | Contact as soon as possible |
| 60–79 | Warm | Follow up and nurture |
| 40–59 | Developing | Continue monitoring |
| Below 40 | Cold | Low-priority nurture |
These ranges are starting points, not universal benchmarks. The right thresholds depend on your business, sales capacity, lead volume, and historical conversion rates.
Then compare each score band with your actual conversion data.
If 80–100-point leads convert at almost the same rate as 40–59-point leads, your scoring model is not separating lead quality effectively.
If almost every lead ends up above 80, the scoring system may be too generous, or your threshold may be too low. Review the point values and score distribution before changing the threshold alone.
The goal is not to create a specific number of “hot” leads. It is to make the highest-scoring leads meaningfully more likely to become qualified opportunities or customers.
How Can You Score Leads Without Marketing Automation?
You can score leads without marketing automation by using a spreadsheet, a basic CRM, or a lightweight sales platform.
The scoring logic is independent of the software. What matters is having clear criteria, consistent point values, and a way to update scores as lead behavior changes.
Score Leads in a Spreadsheet
A spreadsheet is a good starting point when you are testing your scoring model or managing a relatively small number of leads.
Create columns for:
| Lead | Fit | Intent | Engagement | Negative | Total | Status |
|---|---|---|---|---|---|---|
| Sarah | 40 | 35 | 8 | 0 | 83 | Hot |
| Michael | 35 | 20 | 5 | 0 | 60 | Warm |
| David | 15 | 10 | 4 | -10 | 19 | Cold |
You can calculate the total score using a simple spreadsheet formula, then assign a status based on your score bands.
A spreadsheet gives you something important before automation: a way to test whether your scoring logic actually works.
Do not automate a broken scoring model.
First, run the model manually, compare scores with actual sales outcomes, adjust the criteria and weights, and make sure your sales team understands how the system works. Once the model consistently helps you prioritize better leads, you can automate the same logic inside your CRM or marketing platform.
Score Leads With a Basic CRM
A basic CRM can store each scoring component as a custom field.
For example:
- Fit Score
- Intent Score
- Engagement Score
- Negative Score
- Total Score
- Lead Status
A salesperson can update the fields after important interactions.
This approach works well when your team has a modest lead volume and does not need sophisticated behavioral tracking.
Lightweight Sales Tool for Lead Scoring
Yes. A lightweight sales tool can provide the structure around your scoring model without requiring a large marketing automation system.
The scoring itself can remain simple while the platform handles:
- Lead records
- Sales pipelines
- Follow-up tasks
- Lead ownership
- Activity tracking
- Client conversion
That can be enough for a small or growing sales team that wants organization without the complexity of an enterprise CRM.
What Is the Difference Between Lead Scoring, Lead Management, and Pipeline Management?
Lead scoring, lead management, and pipeline management are related but serve different purposes.
| Process | Main Purpose | Key Question |
|---|---|---|
| Lead Scoring | Prioritize prospects | Who should we focus on first? |
| Lead Management | Organize and follow up | How should we manage this prospect? |
| Pipeline Management | Track sales opportunities | Where is this opportunity now? |
For example:
Lead score: 82 → Qualified → Contacted → Proposal → Negotiation → Won
The score helps your team decide where to focus.
Lead management keeps the prospect organized.
Pipeline management tracks the opportunity after it enters the sales process.
For a deeper comparison, see our guide to lead management vs. pipeline management.
How Do You Validate a Lead Scoring Model?
A lead scoring model should be tested against real sales outcomes rather than trusted simply because the numbers look logical.
A useful review can include four checks.
Compare Conversion Rates by Score
Group leads by score range and compare how often they become opportunities or customers.
For example:
| Score Range | Leads | Opportunities | Conversion Rate |
|---|---|---|---|
| 80 to 100 | 50 | 15 | 30% |
| 60 to 79 | 100 | 18 | 18% |
| 40 to 59 | 150 | 12 | 8% |
| Below 40 | 200 | 6 | 3% |
This would suggest that the scoring model is doing a reasonable job separating higher-priority leads from lower-priority ones.
Look for False Negatives
A false negative is a lead that received a low score but eventually became a valuable customer.
Review those customers.
Ask:
What did we miss?
Maybe your best customers share a technology, use case, company type, or job function that your scoring model does not currently measure.
Track Sales Overrides
If sales representatives repeatedly ignore high-scoring leads and pursue lower-scoring leads instead, investigate why.
The sales team may have information that is missing from the scoring model.
That feedback can help you improve the criteria.
Watch for Score Inflation
If average scores rise over time but conversion rates do not improve, your model may be giving too many points for low-value activity.
Common causes include:
- Too many engagement points
- No activity caps
- No score decay
- Too many positive criteria
When this happens, reduce weak signals instead of simply adding more rules.
How Does Data Quality Affect Lead Scoring?
A scoring model is only as reliable as the data behind it.
If a lead’s company size, job title, industry, or contact information is wrong, the final score can be misleading.
Before relying heavily on fit scoring, check for:
- Missing company information
- Incorrect job titles
- Duplicate leads
- Invalid contact details
- Outdated company data
- Incomplete industry information
For example, if two records represent the same person, their activity can be split between them. Both records may then receive lower scores than they should.
Clean data is especially important when you are using numerical scoring because a precise number can create a false sense of confidence.
What Are the Most Common Lead Scoring Mistakes?
The most common lead scoring mistakes are making the model too complicated, giving too much weight to weak activity, ignoring negative signals, and failing to update scores over time.
Giving Every Activity the Same Value
Not all actions show the same level of buying intent. A pricing request is a much stronger signal than a single blog visit, so high-intent actions should receive more weight.
Adding Too Many Criteria
More criteria do not automatically make a scoring model more accurate.
Start with the signals that matter most. If your team cannot clearly explain why a lead received its score, the model may be too complicated.
Ignoring Negative Signals
Without negative scoring, poor-fit leads can rise to the top simply because they are highly active. Factors such as unsubscribing, inactivity, or a poor fit with your target customer profile may need to reduce a lead’s score.
Never Letting Scores Decay
Old activity can make inactive prospects appear more valuable than they really are.
Use score decay to reduce the impact of engagement as it becomes less recent. A prospect who downloaded a guide six months ago should not necessarily have the same score as someone who requested a demo yesterday.
Setting Arbitrary Thresholds
A score of 70 does not automatically mean a lead is sales-ready.
Your threshold should be based on actual conversion data, lead quality, and your sales team’s capacity. Review which scores consistently lead to meaningful sales opportunities and adjust the threshold accordingly.
Building the Model Without Sales Input
Sales representatives often have firsthand knowledge of which signals indicate genuine buying intent.
Include sales feedback when creating and reviewing the scoring model. Their experience can help identify signals that your initial data analysis may miss.
Changing Everything at Once
If you change the weights, criteria, and thresholds at the same time, it becomes difficult to know which change improved or weakened the model.
Change one major element at a time and measure the results over a full sales cycle. This makes it easier to identify what is actually working.
How Can Taskip Help You Manage and Prioritize Leads?
Once you have a scoring model, the next challenge is turning those scores into consistent sales action.
Taskip can help organize the workflow around your lead scoring system, so your team can prioritize prospects, track their progress, and move qualified leads toward conversion.
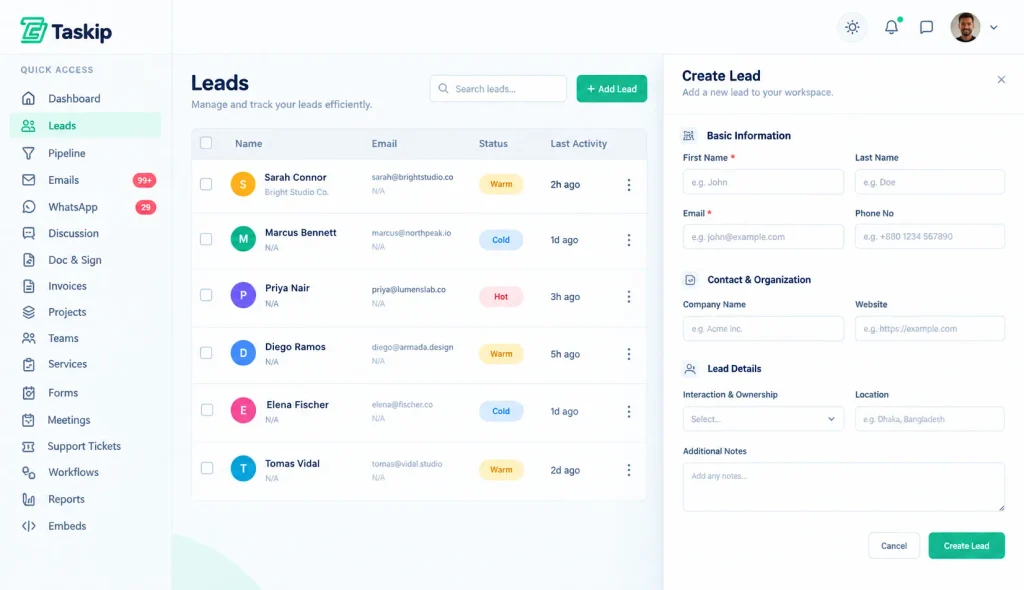
You can use it to:
- Manage unlimited leads in one place, keeping both high-priority prospects and leads that need further nurturing organized.
- Organize leads with sales pipelines, such as New Lead → Qualified → Contacted → Proposal → Negotiation → Won.
- Create leads manually from referrals, networking, phone calls, social media, events, or direct outreach.
- Import and export lead data when moving from spreadsheets or another system.
- Convert leads into clients when a prospect becomes a customer.
Think of it this way:
Lead scoring answers: “Which lead should we prioritize?”
Pipeline management answers: “What is happening with that lead now?”
Together, they turn lead scoring from an isolated number into a practical sales workflow:
Capture → Score → Prioritize → Manage → Convert
Final Thoughts
You don’t need a complex CRM to start scoring leads. A clear ideal customer profile, a few meaningful signals, and a simple scoring model can help your team focus on the right prospects. Start with Fit + Buying Behavior − Negative Signals = Lead Priority, then refine the model using real conversion data. Whether you use a spreadsheet or sales platform, the goal is simple: know which leads deserve your attention next.
If you’re ready to move beyond spreadsheets, Taskip’s Freelance plan starts at $12/month and includes lead management to help you organize prospects, track opportunities, and manage your sales workflow in one place.
Frequently Asked Questions
What Is Lead Scoring in Simple Terms?
Lead scoring is a way to assign points to prospects based on customer fit, buying intent, engagement, and negative signals. The resulting score helps sales teams decide which prospects should receive attention first.
Can You Score Leads Without a CRM?
Yes, you can score leads without a CRM by using a spreadsheet with columns for fit, behavior, negative signals, total score, and lead status. A CRM or sales platform becomes useful as the number of leads and follow-up activities grows.
What Is the Formula for Lead Scoring?
A practical weighted formula is Lead Score = (Fit Score × Fit Weight) + (Behavior Score × Behavior Weight) – Negative Points. The fit and behavior weights should add up to 1, and the final score can be converted into priority categories such as hot, warm, and cold.
What Is a Good Lead Score?
There is no universal good lead score because every business has different customers, sales cycles, and conversion rates. A 100-point model is a useful starting framework, but the actual threshold for a sales-ready lead should be based on your historical results and sales capacity.
How Many Lead Scoring Criteria Should You Use?
Start with about five to eight meaningful criteria rather than trying to score every available data point. A smaller model is easier for salespeople to understand, maintain, and improve.
Should Website Visits Affect Lead Scores?
Website visits can affect lead scores when the pages visited provide meaningful buying signals. Pricing, product, integration, demo, and security pages may be more useful than general blog or careers page visits.
Should Email Opens Count Toward Lead Scores?
Email opens can be included as a weak engagement signal, but they should usually receive fewer points than actions such as demo requests, pricing inquiries, or direct sales replies. Repeated email opens should also have a cap so they do not artificially inflate a lead’s score.
Should Lead Scores Decay Over Time?
Behavioral scores should generally lose value as activity becomes older. A simple starting model could reduce behavioral points after 30 days and remove them after 90 days, but the correct period depends on the company’s typical sales cycle.
What Is Negative Lead Scoring?
Negative lead scoring subtracts points when a prospect has characteristics or behavior that make them less likely to become a customer. Common examples include competitors, students, poor-fit companies, unsubscribed contacts, and prolonged inactivity.
How Do You Know if a Lead Scoring Model Works?
You can evaluate a lead scoring model by comparing conversion rates across score ranges. If high-scoring leads consistently become opportunities or customers at higher rates than low-scoring leads, the model is providing useful prioritization.
How Often Should You Review a Lead Scoring Model?
A lead scoring model can be reviewed quarterly after the initial model has been tested through a meaningful sales cycle. Review conversion rates, false negatives, sales overrides, score distribution, and any changes to your ideal customer profile.
Can Lead Scoring Be Done Manually?
Yes, lead scoring can be done manually with a spreadsheet or basic CRM fields. Manual scoring is practical when the lead volume is manageable, and the scoring criteria are simple and consistently maintained.
Is Lead Scoring Useful for Small Businesses?
Lead scoring can be useful for small businesses when the team has more prospects than it can actively pursue at once. A simple model helps the team rank leads and spend more time on prospects that show stronger fit and buying intent.
What Is the Difference Between Lead Scoring and Lead Qualification?
Lead scoring assigns a numerical priority to prospects, while lead qualification determines whether a prospect meets the requirements for active sales pursuit. A high score can indicate that a lead deserves qualification, but the score does not replace the qualification process.